
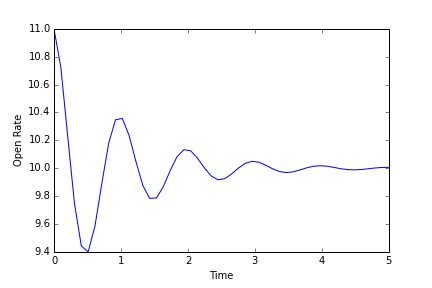
 If you flip a coin 6 times, there is a good chance that it won’t be 50% heads and 50% tails. But, as you flip the coin more times, it will converge to the 50/50 set (unless you have a crooked coin).
Similarly, if you launch an email outreach, your results might be very strange initially. But, as you get more data, they will settle into the long-term solution.
 One of the questions when setting up an A/B test is figuring out how large the different test groups should be. If the test groups are too small, they won't provide sufficient data. If your sample sizes are too big, you are wasting subscribers on the less effective tests.
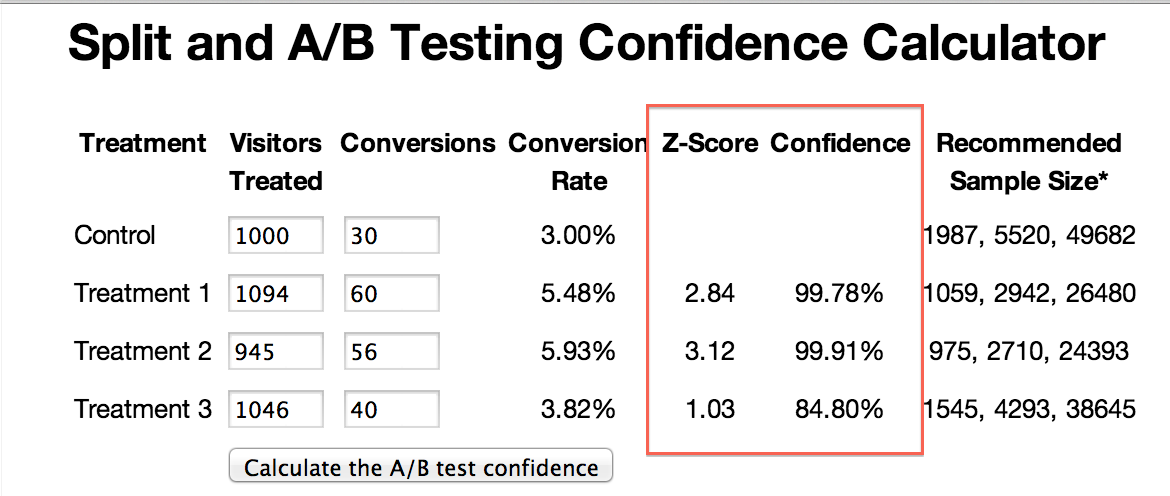
To be confident, we need to do a Z-test between our different samples and ensure we're seeing a statistically significant difference. Simply put, the Z-test helps us know that we're seeing a real difference between our control group and the various test groups.
You can do the Z-test in Excel, Python, R, or by hand, but it's easy and quick to visualize it using this online calculator.
Skipping over a lot of detail, a Z-Score equal or greater to 1.65 lets you have confidence that your test group is sufficiently different than your control.
Hopefully you'll find this limited explanation to be handy when thinking about testing protocols, whether for a landing page or an email outreach campaign.
Want to dive in deeper? Google has a great explanation about the math behind A/B testing.
If you want to even dive deeper, there's some great open source materials available.
COMMENTS