
 If your nonprofit is not developing yearly benchmarks for its fundraising program, website visits, email and e-newsletter open and click-through rates, start now. Establishing benchmarks helps organizations better leverage supporters, engage activists and keep websites dynamic with compelling content that drives people to take action. While benchmarks should be set realistically based on each organizations goals and year-to-year metrics, it’s always important to know what the average benchmarks are for the nonprofit sector and compare how your own metrics measure up. Don’t know where to look? Convio just released their latest benchmark report that examined over 500 nonprofit metrics in 15 sectors.
“Online fundraising and engagement continues to grow at robust double digit rates despite a challenging economy, where most other vehicles are in decline, said Vinay Bhagat, Founder and Chief Strategy Officer of Convio. “Capturing constituent interest is getting harder, as witnessed by lower website visitor to subscriber conversion rates. Offering compelling reasons to join the file is critical. It’s not sufficient to just offer an email newsletter – who really needs another e-newsletter?”
Online Fundraising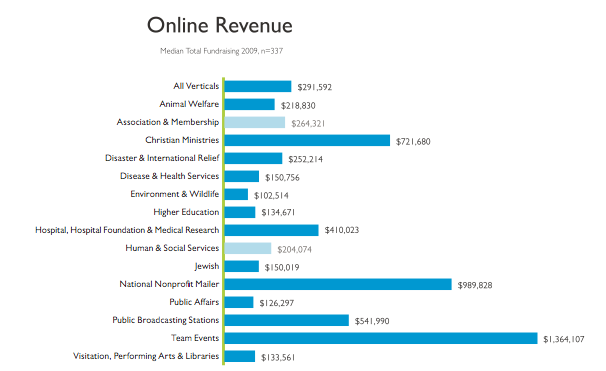
Even in this dismal economy, online donations grew 14% and 69% of nonprofits raised more in 2009 than 2008. The study also noted that 49%of online mid-level and major donors visited a nonprofit's website before donating money online or offline for the very first time. 92% of organizations that grew their fundraising in 2009 had an increase in the number of gifts they receive and 43% of organizations that raised more in 2009 had an increase in their average online gift amount. However it’s not all good news. The economy certainly took its toll. 61% of organizations’ average gifts dropped in 2009.
More Stats
- About 7% of online activists also donated money online to the organization they took action with.
- 8% of online donors also took an online advocacy action with the same organization.
- The average online gift was $80.81
Lesson learned? Online donors are motivated to donate money and take action if you properly cultivate them.
Email Registration Rates
Despite the fact that 60% of nonprofits website traffic slowed down between 2008 to 2009, and only 2% of unique monthly visitors provided their email address to the organization, nonprofits who invested in growing their email lists saw a great return on their investment. Organizations grew their email file by 27%. The median file size was approximately 600K. However, it’s important to note that the study found that only 56% of nonprofits email file was actually usable. Those organizations that operated in more “closed communities” like higher education had a higher percentage of usable emails at 69%.
What should nonprofits do to reverse this trend?
Files become unusable as people opt-out and change email addresses. Some degree of attrition is to be expected. To minimize it, you must start by being thoughtful about how you build your email file in the first place, said Bhagat. “Organically acquired, opted-in constituents are much more likely to continue to subscribe, and give you their updated email address if they change it. Techniques like appends can in some cases drive a positive ROI, especially for lapsed donors, but will tend to perform much worse with regard to open and response rates, and are more likely to become unusable. Secondly, it’s critical to ensure communications are compelling and relevant.”
Open Rates
The study found that constituents have become more reluctant to open emails and click-through. “While open rates for both fundraising appeals and newsletters remained around 20%, the click-through rates for both types of online communication declined in 2009,” said the study. However, many experts question the authenticity of open rates since many email clients use image rendering and preview panes which make it impossible to track those open rates. Nevertheless, open rates should be looked at in terms of measuring larger trends.
Click-Through Rates
The median click-through rate for an:
- Email appeal was 1.7% in 2009, down from 2% in 2008.
- Online fundraising appeal was 0.15%.
- E-newsletter was 3.3% - down from 3.9% in 2008.
What’s Next? How Should Nonprofit’s Utilize These Benchmarks?
- Establish your own organization’s benchmarks.
- Are you segmenting your lists? Do you even know who your passionate core is?
- Establish a plan to re-engage lapsed donors and activists.
- Conducting A/B tests to see which subject lines, messages and actions resonate more with your online members?
- Survey your list to learn more about your members and find out what drives them to donate money to your nonprofit and take action on your issues. Find out what can you do to help them get more involved in your organization.
- Assess your website. Is the content engaging and updated? How’s your SEO?
- Develop a multi-channel marketing plan that includes a combination of earned media, paid advertising, etc. Yes, budgets are tight, but lists can easily become stale if you don’t recruit new blood.
You should follow Frogloop on Twitter.

COMMENTS